LiveBackend/InfraBackend Infrastructure
Procol Analytics
Performance Optimization & Sourcing Engine
Cut analytics response time by 40% and sourcing API latency by 80% through profiling, caching, and query optimization.
The problem
Analytics dashboards and the three main sourcing APIs were too slow for real-time procurement decisions. Reports dragged and API calls stacked up during peak sourcing activity.
The approach
- Profiled hot paths to find where time actually went, not where we assumed.
- Refactored slow queries, added targeted Redis caching, and removed redundant data fetches.
- Tuned the three highest-traffic sourcing APIs end-to-end.
Architecture
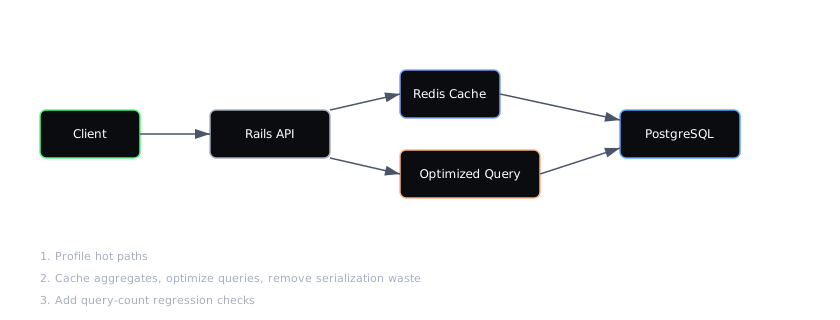
- Client requests hit the Rails API.
- Cache-first lookups go to Redis for aggregates and hot reads.
- Optimized queries fetch only required columns from PostgreSQL.
- Query-count regression checks prevent N+1 reintroductions.
Impact
Analytics response time −40%
Sourcing API latency −80%
What I learned
- The bottleneck is rarely where you first think it is.
- A small number of queries usually drive most of the load.
Tech
Ruby on RailsPostgreSQLRedisAWSPerformance Optimization