Our AI procurement assistant, Clara (how she remembers context across sessions), kept getting OOMKilled every few hours. RSS climbed from ~600 MB to ~3 GB while traffic, latency, and Python object counts all stayed flat.
That last fact is the whole story. Python wasn't leaking. The garbage collector was doing its job. The culprit was the memory allocator underneath Python — glibc malloc — which was holding freed pages hostage because of fragmentation and per-thread arenas.
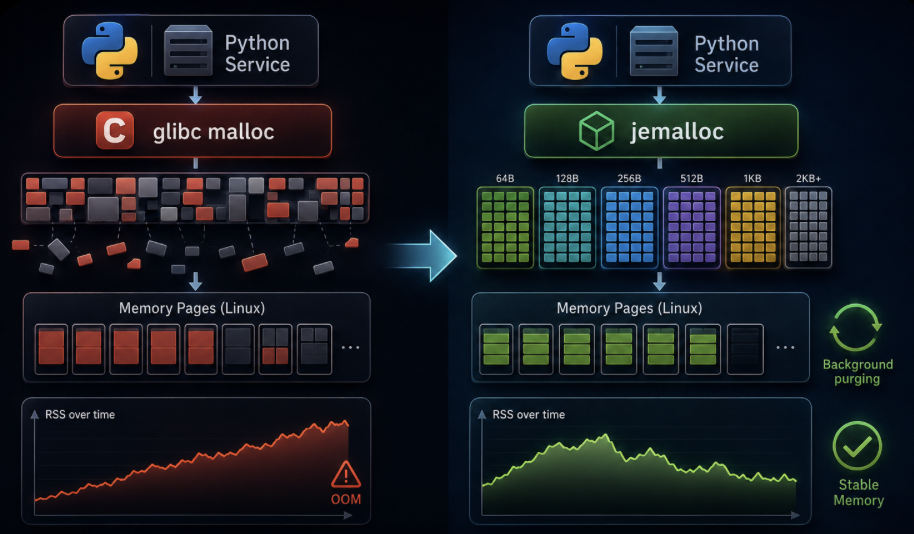
We changed exactly one thing: we swapped glibc for jemalloc using LD_PRELOAD. RSS stopped climbing and started breathing. Same Python. Same objects. ~50% less RAM.
TL;DR: Clara's Python object counts stayed flat while RSS kept climbing; the allocator, not the application, was holding freed pages.
The one thing to remember: Garbage collection answers "is this object still reachable?". The allocator answers a completely different question — "should I give these freed pages back to the OS, or keep them for later?". Rising RSS with stable object counts means the second question is the one biting you.
Some production incidents send you sprinting in exactly the wrong direction. High CPU? Profile the hot paths. Slow queries? Check the indexes (I wrote a whole post on that). Memory climbing forever?
"There's probably a memory leak."
That assumption is so reflexive we rarely stop to question it. So when Clara's memory started doing this, every single one of us thought the same thing:
09:00 RSS: 620 MB10:00 RSS: 890 MB11:00 RSS: 1.4 GB13:00 RSS: 2.3 GB16:00 RSS: 3.1 GB ← Kubernetes: "that's enough."OOMKilled... pod restarts, RSS drops to ~600 MB ...... a few hours later, the exact same curve ...
Nothing weird was happening. Traffic was flat. CPU was normal. p99 latency hadn't moved. GC was running. No deploy had introduced a giant in-memory cache. And yet, like clockwork, the kernel's OOM killer would decide the process had eaten enough, and Kubernetes would restart the pod.
Our on-call dashboard, roughly every four hours.
RSS, by the way, stands for Resident Set Size — the amount of physical RAM the kernel currently has mapped for your process. It's the number Kubernetes watches, the number that trips the OOM killer, and — as we'll see — the number that has surprisingly little to do with how many Python objects you actually have alive.
TL;DR: RSS is physical RAM the kernel counts, and it can increase even when Python has destroyed the same number of objects.
What Clara actually looks like
To understand why this workload hurt glibc, it helps to know what Clara does under the hood.
FastAPI + uvicorn. The main HTTP API runs 2 uvicorn workers handling user-facing endpoints (chat, upload, status). Each worker is a separate Python interpreter, so each gets its own allocator state and its own RSS.
Celery workers (three flavors).extract-worker, call-worker, and email-worker process AI, document, and communication tasks. extract-worker ingests PDFs, invoices, and contracts, runs OCR, and parses layout. call-worker handles LLM-driven call summarization. email-worker classifies, summarizes, and drafts replies. beat-worker + beat run Celery's scheduler.
AI / LLM calls. OpenAI / Anthropic API calls return large, variable JSON blobs and long generated strings. Outputs can be 2–50 KB per call, sometimes larger. The embeddings pipeline creates temporary numpy arrays and tensors for nearest-neighbor search and reranking.
OCR / document parsing. PDF extraction produces byte buffers, temporary images, layout objects, and text spans — highly mixed sizes and lifetimes on the same page.
Redis, SQLAlchemy, Postgres. Redis is Celery broker + cache + result backend. Postgres stores chat sessions and extracted metadata. SQLAlchemy's identity map and async session lifecycle keep objects alive a little longer than the request itself.
That workload is brutal for a general-purpose allocator: mixed sizes, temporal spikes, variable lifetimes, and lots of small temporary objects living next to a few long-lived ones. It is the opposite of "allocate 100 MB once and hold it for hours."
Proving Python wasn't the culprit
Before touching infrastructure, we wanted to answer one question honestly:
Is Python actually holding onto objects?
Because plenty of real leaks look exactly like this — forgotten globals, unbounded caches, circular references, asyncio tasks that never get awaited, a queue that only ever grows. So we went hunting.
Step 1 — Are object counts growing?
If Python is leaking, the number of live objects should climb over time. Simple hypothesis, simple check:
import gcfrom collections import Counter# rough census of live objects by typecounts = Counter(type(o).__name__ for o in gc.get_objects())print(counts.most_common(15))
We logged this every hour. And the counts were… flat. Requests created objects, requests destroyed objects, exactly as designed. No runaway dict. No million-entry list. The heap was breathing normally.
Step 2 — Does forcing GC help?
The classic experiment: manually collect and watch RSS.
GC happily reclaimed cyclic garbage. Objects were freed. And RSS… barely moved. That was the first real clue. The garbage collector was working perfectly. Linux just wasn't seeing any less memory.
If gc.collect() frees objects but RSS barely drops, the problem is below Python.
Step 3 — Object counts don't tell you bytes
gc.get_objects() tells you how many live Python objects exist. It does not tell you how large they are, and it does not tell you how much allocator overhead sits around them.
Imagine two scenarios:
Scenario A: 100,000 small strings, average 50 bytes eachScenario B: 10,000 data frames, average 50,000 bytes each
Scenario A has ten times as many objects but uses one hundredth as much actual memory. A more complete check prints both count and size:
import gcimport sysfrom collections import Counter, defaultdictdef object_report(top_n=10): counts = Counter() sizes = defaultdict(int) for obj in gc.get_objects(): name = type(obj).__name__ counts[name] += 1 try: sizes[name] += sys.getsizeof(obj) except Exception: pass print("By count:") for name, n in counts.most_common(top_n): print(f" {n:>10} {name}") print("\nBy bytes:") for name, total in sorted(sizes.items(), key=lambda x: x[1], reverse=True)[:top_n]: print(f" {total:>12} {name}")object_report()
sys.getsizeof only measures the object itself, not everything it references, so a dict reports its own overhead but not the keys and values inside it. It is still useful for spotting changes. If both counts and sizes are stable while RSS climbs, you have very strong evidence that the problem is below Python.
Flat object counts rule out a reference-count leak, but they do not rule out a memory-pressure problem.
Step 4 — The graph that changed the investigation
Two lines that should move together if there's a leak:
Time: T+0h T+2h T+4h T+6h T+8hObjects: ████████████████████████████████████████████████ flat ~700 MBRSS: ████▌ ██████▌ █████████▌ ████████████▌ climbs to 3 GB actual RAM held by allocator
Object count: flat. RSS: a staircase to the OOM killer. If Python were leaking, those two would rise in lockstep. They didn't. So we asked a heretical question:
Maybe Python isn't the problem at all.
That single reframe is what turned a "find the leak" hunt into an "understand the memory stack" investigation. And to understand why freed objects don't shrink RSS, we have to leave Python entirely and go down a few layers.
Step 5 — A practical diagnostic: tracemalloc
The Python standard library includes tracemalloc, a tool that records where allocations are coming from. It is lightweight enough for staging and short production windows, and it answers the question "is Python's own growth coming from a specific part of the code?" before you start blaming the allocator.
Take snapshots at two points in time and compare them:
snap1 = tracemalloc.take_snapshot()# run the workload you suspectsnap2 = tracemalloc.take_snapshot()for stat in snap2.compare_to(snap1, 'lineno')[:10]: print(stat)
A line like this:
<frozen importlib._bootstrap>:228: size=640 KiB (+320 KiB), count=5003 (+2500), average=131 B
tells you exactly where memory grew. For Clara, tracemalloc showed a flat or gently breathing Python heap while RSS marched upward. That is the condition that makes allocator tuning the right move.
Observation
Interpretation
tracemalloc current climbs with RSS
Likely a real Python-side growth problem — find the line.
tracemalloc current stays flat, RSS climbs
The allocator is retaining pages.
tracemalloc current drops after GC, RSS barely moves
Exactly the glibc/jemalloc page-retention pattern.
Python doesn't own your memory
Here's the mental model almost everyone carries around:
Python → RAM
It's not wrong so much as it's missing every layer that actually matters. Reality is a stack, and each layer makes its own independent decisions:
┌────────────────────────────────────┐ example decision│ Python objects "name='Saksham'" │ "is this dict still reachable?"├────────────────────────────────────┤│ pymalloc pools ≤512 B objects │ "which 4 KB pool does this fit in?"├────────────────────────────────────┤│ system allocator malloc()/free() │ "return this page, or keep it?" ← main villain├────────────────────────────────────┤│ virtual memory 4 KB pages │ "map these virtual pages to RAM"├────────────────────────────────────┤│ Linux kernel page tables │ "which physical frames back this?"├────────────────────────────────────┤│ physical RAM DIMMs │ actual hardware└────────────────────────────────────┘
When Python destroys an object, that does not mean Linux immediately gets memory back. "Python freed the object" and "the process returned pages to the OS" are two completely different events, separated by two layers of caching and bookkeeping. Almost every "Python memory leak that isn't a leak" lives in that gap.
The allocator Python runs before glibc: pymalloc
Python does not hand every object straight to malloc. That would be slow, because Python creates and destroys an enormous number of very small objects. Instead, CPython ships with its own small-object allocator called pymalloc.
pymalloc organizes memory into three nested levels:
Arenas are 256 KB blocks. CPython asks the system allocator for 256 KB at a time.
Each arena is sliced into pools of 4 KB. One arena holds exactly 64 pools.
Each pool serves exactly one size class: 8, 16, 24, 32, 40, 48, 56, 64 bytes, and so on up to 512 bytes. If you ask Python for an object that needs 37 bytes internally, pymalloc rounds it up to 40 bytes and serves it from a 40-byte pool.
arena (256 KB)┌─────┬─────┬─────┬─────┬─────┬─────┬─────┬─────┐│pool │pool │pool │pool │pool │pool │pool │pool │ ... 64 pools total│4 KB │4 KB │4 KB │4 KB │4 KB │4 KB │4 KB │4 KB │└─────┴─────┴─────┴─────┴─────┴─────┴─────┴─────┘4 KB pool for 40-byte size class┌────────┬────────┬────────┬────────┬───┬────────┐│ 40 B │ 40 B │ 40 B │ 40 B │...│ 40 B │ 102 objects per pool└────────┴────────┴────────┴────────┴───┴────────┘
When a small Python object is garbage collected, pymalloc does not normally return its slot to the system allocator. It pushes that slot onto a free list for that size class. The next time Python needs a 40-byte object, pymalloc pops the slot off the list. No system call.
But the speed comes from retaining memory inside the process. pymalloc returns memory to the system allocator only at the arena level, and an entire arena can be released only when all 64 of its pools are completely empty. Because a single busy slot pins an entire 4 KB pool, and a single busy pool pins an entire 256 KB arena, it is easy for pymalloc to hold onto memory that looks "freed" from Python's perspective.
Most memory bugs come from debugging one layer while the problem lives in another. We were profiling the Python heap. The problem was two floors down.
How memory actually works: pages, not bytes
Memory is not RAM
When your program allocates memory, it does not immediately receive RAM. It receives virtual memory.
Linux gives every process a private, contiguous-looking address space. Two processes can both use address 0x7fff_1234_5000 because the address is virtual. The kernel translates it to the real physical location, which might be RAM, swap, or nowhere yet.
Why the indirection? Isolation and security. If programs touched physical RAM directly, one bug could overwrite another process's data, and one exploit could read every password in memory. Virtual memory gives each process its own sandbox while the kernel scatters pages across physical RAM.
Everything becomes pages
The kernel doesn't manage memory byte-by-byte. It manages fixed-size blocks called pages. On most Linux systems a page is 4 KB.
Ask for 10 MB → Linux thinks: "2,560 pages, please."
So Linux thinks in pages, and — here's the part that explains half of all "leaks" —
Pages are the unit of ownership
Linux doesn't reclaim 16 bytes. It reclaims 4 KB pages. Watch what that means. Start with one page holding several small allocations:
Page (4 KB): [████████████████████████████████] fully used
Now free almost everything, leaving one tiny object alive:
Can Linux reclaim this page? No. One live 16-byte object pins the entire 4 KB page in your process. RSS stays up. Tuck this idea away; we'll cash it in twice.
Critical takeaway: A page is only reclaimable when every allocation on it is dead. A single live object turns a nearly empty 4 KB page into 4 KB of resident memory.
Demand paging: reserving ≠ consuming
One more twist. Even when Linux maps virtual memory, no physical RAM is consumed until you actually touch it.
malloc(100 MB) → 100 MB of virtual address space reserved → RSS unchanged (!!)first write to a page → NOW a physical page is allocated → RSS grows
This is demand paging, and allocators lean on it hard: they grab big regions of address space cheaply and only pay real RAM for pages they actually use. Keep this in mind — it's exactly how jemalloc can "hold" address space it isn't costing you RAM for.
From pages to allocations: brk, mmap, and why malloc exists
The kernel deals in pages. Your program does not. When Python runs:
name = "Saksham"
it isn't asking Linux "may I have one page?" — it needs ~48 bytes. A busy service does millions of these tiny allocations per second. If every one required a kernel call, your app would spend more time crossing into the kernel than doing actual work.
The allocator is a warehouse manager
Linux owns the land. The allocator runs the warehouse. Your app just asks the warehouse manager for shelf space.
Python → malloc() → Allocator → (rarely) Linux
The allocator requests big chunks from Linux, then subdivides them into tiny allocations with pure bookkeeping — no kernel call:
Linux hands over 64 MB:[░░░░░░░░░░░░░░░░░░░░░░░░░░░░░░░░░░░░░░░░░░░░]malloc(64) → [██░░░░░░░░░░░░░░░░░░░░░░░░░░░░░░░░░░░░░░░░░░]malloc(128) → [██████░░░░░░░░░░░░░░░░░░░░░░░░░░░░░░░░░░░░░░]malloc(32) → [███████░░░░░░░░░░░░░░░░░░░░░░░░░░░░░░░░░░░░░]
No kernel calls. No page mapping. Just moving a bookmark. This is why allocators exist.
Where the allocator gets memory: brk vs mmap
Eventually the warehouse runs low and does have to ask Linux. Historically there are two mechanisms, and the difference explains a lot of glibc's behavior.
brk() — grow the heap. Every process has a heap, a region that grows in one direction by moving a pointer called the program break.
brk heap grows rightward:[███live███░░░░free░░░░] ↑ brk pointer hereafter more allocations:[███live██████live███░░░]after freeing the middle block:[███live███░░░hole░░░███live███] ↑ brk cannot move back — the hole is trapped behind live memory
Simple and efficient for many small allocations. The catch: the heap can only shrink from the very end. Free something in the middle and you get a hole the heap can't give back.
mmap() — a dedicated mapping. Large allocations bypass the heap entirely and get their own independent region. When freed, Linux can unmap the whole thing instantly.
mmap(100 MB) → its own mapping → free() → mapping vanishes cleanly
Heap (brk)
mmap
Shape
one contiguous growing heap
independent mappings
Great for
many small allocations
large allocations
Release
only from the end
unmap anytime, fully
Fragmentation
more susceptible
less susceptible
Your application never chooses — the allocator does, based on size and its own thresholds. glibc dynamically tunes its mmap threshold. jemalloc has a totally different strategy.
Inside glibc malloc: chunks, bins, arenas
malloc() is not a magic OS feature. It's just a function that comes from a library — usually glibc, the default on nearly every Linux distro. When you call malloc(128), you jump into glibc's code, not the kernel. Only when glibc runs dry does it ask Linux for more pages.
Where glibc malloc came from
The allocator inside glibc is a direct descendant of ptmalloc2 ("pthreads malloc, version 2"), originally written by Wolfram Gloger in the early 2000s to add per-thread arenas on top of Doug Lea's dlmalloc. That heritage explains many of its characteristics:
Arenas were the original scaling mechanism for multi-threaded programs.
Fast bins, small bins, large bins, unsorted bin come straight from dlmalloc's segregated-freelist design.
tcache is a later addition (glibc 2.26, 2017) to reduce contention even further.
glibc malloc is a general-purpose allocator refined over decades for a huge variety of workloads, not a server-specialized one.
Everything is a chunk
glibc doesn't think in "objects." It thinks in chunks — contiguous regions it manages. And a chunk is bigger than what you asked for, because it carries metadata immediately before the pointer it hands you:
┌───────────────┬────────────────────────────────┐│ size (8 B) │ flags (8 B) │ your payload ││ prev_size │ │ │├───────────────┴─────────────┼──────────────────┤│ metadata │ malloc returns ││ 16 B │ pointer here │└─────────────────────────────┴──────────────────┘
Three flags live in the low bits of the size field:
PREV_INUSE — the chunk before this one is currently allocated.
IS_MMAPPED — this chunk came directly from mmap(), not the heap.
NON_MAIN_ARENA — this chunk belongs to a thread arena.
That's how free(ptr) knows the size — it just reads backwards. Every allocation pays for that metadata.
free() does not return memory to Linux
This is the single biggest misconception about malloc:
free(ptr) → glibc marks the chunk FREE → keeps it for reuse
Critical takeaway:free() asks the allocator to remember a chunk for reuse. It does not ask Linux to remove the physical page from your process.
glibc's reasoning: "You freed a 64-byte chunk? You'll probably want another one in a millisecond. I'll hold it." For a web server doing allocate → free → allocate → free thousands of times a second, returning every freed byte to the kernel would be performance suicide. So the chunk stays inside your process, reusable but not released. Which means RSS stays up even though "you freed it."
Bins: the shelving system
To find a free chunk fast, glibc sorts them onto shelves called bins, grouped by size:
glibc arena
  ├── Fast bins      → tiny chunks, LIFO, no coalescing on free
  ├── Small bins     → 62 fixed-size bins (16, 24, 32, ..., 504 bytes)
  ├── Large bins     → bigger ranges, sorted by size
  ├── Unsorted bin   → staging area before being sorted
  └── Thread cache   → per-thread bucket cache (tcache)
Fastbins. Size range 16–160 bytes. Freed chunks go to the head of a singly-linked list. Frees are extremely fast because free() does not coalesce with neighbors. The cost: deferred coalescing leaves many small holes sitting around. This trade-off is perfect for short-lived CLI programs, punishing for hours-old Python servers.
Small bins. Size range 16–504 bytes, with 62 bins of width 8 bytes. Doubly linked, sorted by exact size. Coalescing is performed on free. Allocation and free are slightly slower than fastbins but fragmentation is lower. Python's most common object sizes often land here.
Large bins. Chunks larger than 512 bytes, grouped into logarithmic ranges. They are kept sorted by size so malloc() can find a best fit. Because wasting 200 KB matters more than wasting 16 bytes, large bins invest more CPU in searching.
Unsorted bin. A single unsorted list where recently freed chunks land first. malloc() scans it before falling back to sorted bins because the chunk just freed is likely the chunk the next request needs.
tcache. Added in glibc 2.26, a per-thread array of small LIFO caches for chunks up to 1032 bytes. Most small malloc()/free() calls never touch shared state. Faster, but one more layer that retains memory.
Two housekeeping operations keep this sane: splitting (carve a big free chunk into "allocated + remainder") and coalescing (merge adjacent free chunks back into one big one). Every allocator lives on the tension between fast allocation and low memory usage.
Arenas: the part that quietly grows your RSS
Most people picture one heap per process. Reality:
Python process
  ├── Arena 1   (bins, top chunk, metadata, its own locks)
  ├── Arena 2   (bins, top chunk, metadata, its own locks)
  ├── Arena 3   ...
  └── Arena N
Each arena is almost a mini-allocator of its own. Why? Lock contention. With one shared heap and 64 threads, every malloc() fights for the same lock and throughput collapses. Multiple arenas let many threads allocate in parallel.
But arenas have a cost that's central to our whole story:
Arena fragmentation: each arena manages its memory independently. If Arena 1 has 400 MB free but Arena 2 needs 300 MB, Arena 2 generally can't borrow from Arena 1 — Linux just hands out another 300 MB. Free memory exists inside your process, but RSS still grows.
How many arenas does glibc make by default? On 64-bit systems, up to 8× the number of CPU cores (confirmed in the glibc manual and Red Hat's malloc internals writeup; 2× cores on 32-bit). On a 16-core box that's up to 128 arenas, each free to hoard its own partially-used pages.
You can cap it:
export MALLOC_ARENA_MAX=2
For Python specifically, the GIL already serializes bytecode execution, so a swarm of arenas often buys little throughput while inflating RSS. MALLOC_ARENA_MAX=2 is one of the most common first-aid fixes for exactly our symptom.
Tuning glibc with mallopt() and environment variables
glibc exposes several tunables that matter for long-running Python processes:
Tunable
How to set
Typical effect
M_MMAP_THRESHOLD
mallopt(M_MMAP_THRESHOLD, 65536) or MALLOC_MMAP_THRESHOLD_=65536
Allocations larger than this are served with mmap(). Lower values return large chunks cleanly on free but increase mmap/munmap overhead. Default is usually 128 KiB and dynamic after glibc 2.33.
M_MMAP_MAX
mallopt(M_MMAP_MAX, 65536)
Maximum number of simultaneous mmap-backed chunks.
M_ARENA_MAX
mallopt(M_ARENA_MAX, 2) or MALLOC_ARENA_MAX=2
Caps the number of arenas. Fewer arenas reduce cross-arena fragmentation.
M_TRIM_THRESHOLD
mallopt(M_TRIM_THRESHOLD, 131072) or MALLOC_TRIM_THRESHOLD_=131072
Free memory at the top of the heap that must accumulate before glibc considers returning pages via sbrk().
M_TOP_PAD
mallopt(M_TOP_PAD, 131072) or MALLOC_TOP_PAD_=131072
Extra bytes requested when expanding the heap to amortize future growth.
Caution:mallopt() must be called early, before significant allocation has happened. Calling it after threads and objects are alive usually has no useful effect.
Why RSS climbs — the full chain
Put the pieces together and the "leak that isn't a leak" becomes mechanical. Each freed chunk stays inside glibc instead of going back to Linux. Fast bins defer merging; tcache keeps per-thread stashes; arenas hoard their own pages; and any surviving object pins a whole 4 KB page. The result:
Live Python objects ≈ 700 MBRSS ≈ 2.8 GB ← 2.1 GB held by allocator retention + fragmentation
glibc isn't leaking. It's making a speed-over-footprint trade-off that's correct for a command-line tool and wrong for a long-running service with wildly varying allocation sizes.
A crash course in fragmentation
We keep using the word fragmentation. It is worth stopping and building the idea from scratch, because once you see the geometry, glibc's behavior and the jemalloc design both become obvious.
Two kinds of fragmentation
Internal fragmentation is waste inside an allocation. The allocator gives you more than you asked for, usually for metadata or alignment.
Requested: 100 bytesAllocator gives: 128 bytesWaste: 28 bytes inside the allocation[ metadata | 100 bytes you use | 28 bytes internal waste ]
External fragmentation is waste between allocations. Freeing objects leaves scattered holes across otherwise-used pages. The total free memory can be large, but none of the holes are big enough for the next request. Worse, a single live allocation can pin an entire 4 KB page.
One page (4 KB) after several frees:[ live 64 | free 192 | live 128 | free 448 | live 32 | free remainder ]Total free space: ≈ 3.1 KBUsable for one 2 KB allocation? No — holes are not contiguous.Returnable to Linux? No — three live objects pin the whole page.
Internal fragmentation wastes bytes inside a live allocation; external fragmentation wastes entire pages around live allocations.
Why the page is the problem: an arithmetic example
Consider a 4,096-byte page and three allocator strategies:
Strategy
Bytes actually used
Bytes pinned / unusable
Utilization
Uniform 64-byte objects, all live
4,096
0
100 %
Uniform 64-byte objects, 8 freed
3,584
512
87.5 %
Mixed sizes, half the objects freed
~2,048
~2,048
~50 %
Mixed sizes, one tiny object stays alive
64
4,032
~1.5 %
The last row is the production gotcha. The application freed 99 % of its bytes, but Linux cannot reclaim anything because the page is still "owned." RSS stays at 4 KB to host a single 64-byte allocation.
How a long-running service accumulates fragmentation
Fragmentation does not require a memory leak. It only requires two things working together:
Allocation sizes vary. A request allocates one large buffer, a few medium dicts, and many small strings.
Object lifetimes vary even for objects on the same page. After the request ends, most objects die, but one or two live on.
request 1 request 2 request 3page A: [██████████████░░] [██████████░░░░░░] [████░░░░░░░░░░░░]page B: [████████████░░░░] [██████████████░░] [████████░░░░░░░░]page C: [██████████░░░░░░] [████████████░░░░] [██████░░░░░░░░░░]Each page ends with a few live objects (black) and a lot of freed holes (gray).Total live bytes: falling. Total resident pages: unchanged. Fragmentation: up.
Repeat this for millions of requests over hours or days. The live-object count plateaus or falls; RSS keeps climbing.
Why defragmentation is hard for non-compacting allocators
There are only two ways to fix external fragmentation:
Wait until every object on a page happens to die. Non-compacting allocators do this.
Move the live objects somewhere else and free the page. This is compaction.
C and C++ allocators generally cannot compact the heap because compaction changes addresses, and C code is full of raw pointers. If a live object is moved, every pointer to it must be updated — and the allocator cannot see pointers stored in program variables.
Languages with managed references (Java, Go, .NET) can compact because the runtime tracks every reference. glibc and jemalloc cannot. That is why defragmentation is a waiting game: you can only return a page when it becomes fully empty.
But doesn't malloc_trim() fix it?
malloc_trim(0) asks glibc to release completely free pages back to Linux. It returns 1 if any memory was released and 0 if nothing could be trimmed.
It works well when:
The top chunk of an arena is large and mostly untouched.
A batch of large mmap-backed chunks was freed.
The heap has a contiguous free span at the very end.
It fails when:
Fragmentation leaves live objects scattered across pages.
Free memory lives in a non-top arena while another arena still needs pages.
Fastbin chunks are not coalesced, so pages containing fastbin entries remain partially used.
Run this inside a long-running process. If it repeatedly returns 0 while RSS is high, fragmentation is almost certainly the reason.
Because Python services are frequently fragmented, malloc_trim(0) is best treated as a diagnostic signal, not a fix.
Inside jemalloc: designing for long-running servers
Why do Meta, Redis, ClickHouse, Firefox, and TiDB reach for jemalloc? Because it optimizes for a different workload.
glibc asks: "how do I allocate as fast as possible?"
jemalloc asks: "how do I keep memory usable after a billion allocations?"
The headline difference: glibc cleans up fragmentation afterward; jemalloc avoids creating it in the first place.
Critical takeaway: jemalloc is not universally better. It optimizes for long-running servers with many small, short-lived allocations.
Big idea #1: size classes
jemalloc does not allocate arbitrary sizes. Every request is rounded up to the nearest predefined size class. Freed slots are always standard sizes, so the next allocation fits exactly.
Small allocations are those up to 14,528 bytes on a 4 KiB page build. Larger requests are large or huge.
The rounding creates internal fragmentation (a 61-byte request gets 64 bytes, wasting 3), but because every free slot is a standard size, external fragmentation drops far more than internal fragmentation grows.
Big idea #2: slabs (runs) — one size per region
jemalloc carves memory into runs (a.k.a. slabs), where each run holds exactly one size class. Think of an egg carton — every slot identical.
glibc is like a junk drawer in a kitchen: batteries, rubber bands, a single spoon, old receipts. Every new item is a different shape, so most of the drawer is air. jemalloc is like an egg carton: every slot is exactly the same size. When the carton is empty you can stack it flat in the recycling bin.
Objects of similar size are often born and die together. Because jemalloc grouped them into the same slab, an entire slab tends to empty out at once. And an entirely empty region is exactly what Linux can reclaim.
Big idea #3: arenas, tcache, and extents
jemalloc divides the process into arenas. By default the number is roughly four times the number of logical CPUs. You can override with narenas:N.
This is very different from glibc:
glibc
jemalloc
Default arena cap
up to 8× cores on 64-bit
~4× cores
Thread assignment
round-robin / on demand
round-robin
Free memory sharing
arenas never share
per-thread caches smooth reuse
For Python under the GIL, many arenas are usually overkill. Setting narenas:2 or narenas:4 is common because fewer arenas mean freed memory is more likely to be reused instead of asking Linux for new pages.
The core allocation unit is the extent: a contiguous range of pages. An extent can be:
a slab holding one small size class,
a group of pages serving one large allocation,
or a huge mapping backed directly by mmap.
A single live object in a slab still pins that slab's pages, just like the page-pinning rule. But because all slots in a slab are the same size and tend to have similar lifetimes, whole slabs commonly empty out together.
The page lifecycle: dirty → muzzy → retained
jemalloc tracks every extent through four states:
Application frees memory │ ▼┌──────────────────────────────────────────────┐│ Dirty page still in RAM, instantly reusable│ RSS stays high, reuse is fastest├──────────────────────────────────────────────┤│ Muzzy madvise(MADV_FREE) sent to kernel │ RSS may drop; kernel can steal├──────────────────────────────────────────────┤│ Retained physical RAM returned │ RSS drops; virtual address kept│ virtual mapping reserved │ re-mmap not needed later└──────────────────────────────────────────────┘ │ ▼ future allocation reuses: dirty → muzzy → retained → grow
Dirty — freed by the app but still fully backed by RAM and instantly reusable.
Muzzy — jemalloc told the kernel "reclaim these physical pages if you need pressure" via madvise(MADV_FREE). The pages stay mapped and can be faulted back cheaply.
Retained — physical memory returned, but the virtual address space is kept so jemalloc can recycle it later without a fresh mmap.
Decay and background purging
Returning every freed page to the OS immediately would minimize RSS but would cause constant madvise/page-fault churn. jemalloc uses a decay algorithm: freed dirty pages age gradually, and a configurable fraction is purged over time.
Two tunables control the half-life:
dirty_decay_ms — how fast dirty pages move toward muzzy/retained.
muzzy_decay_ms — how fast muzzy pages move to retained.
Default values are around 10 seconds each.
Setting
Effect
Shorter (e.g., 5,000 ms)
Lower RSS, more CPU spent purging
Longer (e.g., 30,000 ms)
Less CPU, higher RSS, better burst resilience
Background purging. Without background_thread:true, purging happens on the allocation path. With it enabled:
Your latency doesn't eat the cleanup cost, and RSS drifts down on its own. This is the behavior glibc simply doesn't have out of the box.
TL;DR: jemalloc purges memory on a background thread so request latency does not pay the cost.
glibc vs jemalloc, side by side
glibc malloc
jemalloc
Optimized for
general-purpose, short-lived programs
long-running servers
Allocation layout
mixed sizes per page
one size class per slab
Fragmentation strategy
clean up after
avoid up front
Returning pages to OS
reluctant (malloc_trim, best-effort)
active decay + background purge
Arenas on 64-bit
up to 8 × cores by default
~4 × cores, configurable
Enable it
default
LD_PRELOAD, zero code change
The nuance that matters: jemalloc isn't "better." It's a different trade-off.
The wider allocator landscape
jemalloc is not the only alternative. The server allocator landscape includes tcmalloc from Google, mimalloc from Microsoft Research, and snmalloc — each optimizing for a different point on the fragmentation-throughput-security spectrum.
tcmalloc (Google)
tcmalloc (Thread-Caching Malloc) originated inside Google. Its central idea is a per-thread cache of small objects fronting a central heap organized by size classes.
Throughput: Very high for small allocations because most operations are lock-free and thread-local.
Fragmentation: Generally lower than glibc for short-lived objects, but per-thread caches can retain memory.
Best known for: High request throughput; used by gRPC and Google's production binaries.
Trade-off: tcmalloc often beats jemalloc on raw allocation throughput, but it can return pages to the OS less eagerly unless tuned.
mimalloc (Microsoft Research)
mimalloc was designed with two goals: performance and security. It uses small, fixed-size pages per size class.
Throughput: Competitive with tcmalloc and jemalloc.
Fragmentation: Low by design, because each mimalloc page serves exactly one size class.
Trade-off: mimalloc is newer and has fewer real-world Python deployment guides than jemalloc, but it is a serious alternative if fragmentation or security is the dominant concern.
snmalloc (Microsoft Research)
snmalloc is designed for large-scale, message-passing, multi-core systems. It minimizes global state by giving each core its own allocator.
Throughput: Excellent in highly concurrent scenarios.
Fragmentation: Generally low.
Best known for: Strong safety guarantees; used by research systems like Verona and CHERI.
Trade-off: snmalloc is the least mainstream of the four for Python teams and prebuilt packages are less common.
Decision matrix by workload
Workload
Recommended starting point
Rationale
Short CLI / one-off script
glibc malloc
Fragmentation never has time to matter.
Web server (FastAPI, Django, Flask)
jemalloc
Long-running, many small allocations per request.
Database / cache (Redis, ClickHouse)
jemalloc or tcmalloc
jemalloc is Redis's historic choice; tcmalloc can win on throughput.
AI inference server
jemalloc or mimalloc
Large tensors plus small metadata churn.
Safety-critical / sandboxed runtime
snmalloc or mimalloc
Guard pages and double-free detection matter most.
Platform availability
Platform
jemalloc
tcmalloc
mimalloc
snmalloc
Linux glibc
Packaged on Debian/Ubuntu (libjemalloc2), Fedora, Arch
Available in gperftools or Abseil
Available, may need build
Usually build from source
Linux musl / Alpine
Build from source
Build from source
Build from source
Build from source
macOS
Homebrew
Build / Homebrew
Homebrew
Build from source
Windows
Build from source
Build from source
First-class support
Build from source
On Alpine Linux, the easiest path is usually to switch from a musl-based image to a glibc-based image if you want to LD_PRELOAD an allocator.
The actual fix: three environment variables
Here's the anticlimactic part. We changed no Python code. No object pools, no GC tuning, no cache rewrites. We swapped the allocator underneath the whole process. Clara runs as systemd services, so the change was a few Environment= lines.
No recompile, no source changes. Every library in the process that calls malloc — CPython itself, uvicorn, requests, OpenSSL, your C extensions — silently benefits.
Prerequisite / footgun: the .so must actually exist. On Ubuntu/Debian install with sudo apt-get install -y libjemalloc2; on RHEL/Fedora use sudo dnf install jemalloc; on macOS brew install jemalloc (path will differ).
# find the real path on your boxldconfig -p | grep libjemallocls -la /usr/lib/x86_64-linux-gnu/libjemalloc.so.2
Add a CI/deploy-time check to avoid silent fallback:
test -f /usr/lib/x86_64-linux-gnu/libjemalloc.so.2 || exit 1
PYTHONMALLOC=malloc — route everything through one allocator
By default Python uses pymalloc for objects up to 512 bytes:
default: Python objects → pymalloc → glibc
Setting PYTHONMALLOC=malloc disables pymalloc so Python allocates directly through the system allocator (now jemalloc):
after: Python objects → jemalloc → Linux pages
For Clara, the reasoning was: if jemalloc is responsible for nearly every allocation, then its size classes, slab layout, decay, and background purging apply to the whole process. There is no second allocator above it hoarding 256 KB arenas and delaying release.
When PYTHONMALLOC=malloc makes sense:
You have switched to an allocator like jemalloc that handles small allocations well.
You want one set of knobs, one set of metrics, and one fragmentation model.
You are running tools like Valgrind that need to see every allocation.
When to keep PYTHONMALLOC=pymalloc:
Your workload is dominated by millions of tiny, short-lived Python objects.
You have not switched the system allocator.
You benchmarked malloc and it was slower or did not reduce RSS.
Honesty callout: do not disable pymalloc by default. Treat PYTHONMALLOC=malloc as a tuning knob you test under your actual load, not as a universally good companion to jemalloc.
MALLOC_CONF — tune jemalloc itself
This configures jemalloc's internals:
narenas:2 — Clara runs only 2 uvicorn workers, so 2 arenas is plenty. Fewer arenas → less retained memory.
background_thread:true — spins up the async purge thread so freed pages get returned to the OS without stalling request handlers.
The abort_conf:true option makes jemalcon abort on startup if the config string contains a typo. Enable it in staging/CI, validate the exact string, then keep it in production if you can tolerate a loud failure over a silently ignored tuning string.
If the grep count is 0, you're silently still on glibc — the most common "why didn't it work?" gotcha.
Critical takeaway: You can swap the allocator with zero code changes, but always verify LD_PRELOAD actually loaded by checking /proc/<pid>/maps.
A production diagnosis playbook
Most teams don't need to be convinced that allocator fragmentation exists — they need a safe, step-by-step way to prove it in their stack. This is the checklist we have used for every Python service since Clara.
Step 0 — stabilize the scene
Before changing anything, make sure you can reproduce the curve:
Pick a process that has been running > 30 minutes.
Confirm traffic is stable, or normalize RSS per request.
import gcfrom collections import Countersample = Counter(type(o).__name__ for o in gc.get_objects())for name, count in sample.most_common(10): print(f"{name:30} {count}")
Run 30–60 minutes apart. If dict, list, str, and your request classes are not systematically higher, object growth is not the driver.
If the first six steps confirm stable objects + rising RSS, swap the allocator. Canary one pod first, plot RSS and p99 latency for 24 hours, verify jemalloc loaded, then propagate.
Reproducing locally
You don't need production traffic to reproduce allocator fragmentation. The following script generates alloc/free waves with random anchors:
# fragmentation_repro.pyimport os, random, timefrom concurrent.futures import ThreadPoolExecutorimport psutilLIVE_ANCHORS = []SIZES = [64, 128, 256, 512, 1024, 2048, 4096, 8192, 16_384]def mb(): return psutil.Process(os.getpid()).memory_info().rss / (1024 * 1024)def burst(_): kept = [] for _ in range(50_000): buf = bytearray(random.choice(SIZES)) if random.random() < 0.05: kept.append(buf) return random.sample(kept, min(len(kept), 20))for i in range(20): start = mb() with ThreadPoolExecutor(max_workers=8) as ex: for batch in ex.map(burst, range(8)): LIVE_ANCHORS.extend(batch) if len(LIVE_ANCHORS) > 1000: LIVE_ANCHORS[:] = random.sample(LIVE_ANCHORS, 500) time.sleep(1) print(f"burst={i:02d} rss={mb():.1f} MB delta={mb()-start:+.1f} MB anchors={len(LIVE_ANCHORS)}")
The real-world payoff wasn't just a prettier graph — it was capacity. The same server now runs more autopilot workers and more API workers because we freed up half the RAM we were needlessly holding. Same hardware, more headroom. (This is the same lever, from a different angle, that earlier let us cut a Rails monolith's bill — see −25% server cost with Puma & malloc tuning.)
How to verify jemalloc actually loaded
Don't trust, verify. After deploying, confirm the allocator is really in the process:
# 1. jemalloc mapped into the process?cat /proc/$(pidof -s python3)/maps | grep jemalloc# 2. env vars actually applied?cat /proc/$(pidof -s python3)/environ | tr '\0' '\n' | grep -E 'PYTHONMALLOC|MALLOC_CONF|LD_PRELOAD'# 3. RSS, before vs afterps -o rss= -p $(pidof -s python3)
When should you reach for jemalloc — and when not to
Swapping allocators without understanding the problem is cargo-cult engineering. Measure first. This is a great fit when all of these are true:
Good fit for jemalloc
Skip it / look elsewhere
Long-running service (days/weeks)
Short-lived CLI or script
RSS creeps up over time
RSS is already flat
Python object counts stay stable
Object counts grow → it's a real leak, fix the code
Do the diagnosis first. If object counts are climbing, no allocator on earth will save you — you have an actual leak and jemalloc will just delay the OOM.
And you don't have to jump straight to jemalloc. The cheap first experiments, in order:
MALLOC_ARENA_MAX=2 — cap glibc's arenas (one line, no new dependency).
Periodic malloc_trim(0) — sometimes helps, often doesn't (page pinning).
LD_PRELOAD jemalloc with background_thread:true — the real fix for our case.
Our whole investigation echoes a wider pattern: engineers across FastAPI (BetterUp), data pipelines, and databases keep landing on the same conclusion — fragmented pages, not leaks. BetterUp measured RSS creep drop from ~1.25 MB/hr to ~0.12 MB/hr — a 10× improvement — from the allocator swap alone.
FAQ
Why does my Python service's RSS keep growing if object counts are flat?
Because freed Python objects do not immediately return their underlying memory pages to Linux. The system allocator (usually glibc malloc) may keep those pages for reuse, especially when arenas, fast bins, or thread caches retain partially used pages. Stable object counts with rising RSS usually point to allocator retention or fragmentation, not a Python leak.
Is jemalloc faster than glibc malloc?
Not necessarily faster for every workload. jemalloc optimizes for long-running server processes by reducing fragmentation and returning memory to the OS in the background. glibc is often faster for short-lived, general-purpose programs. The right choice depends on workload, not a universal ranking.
Can I use jemalloc with FastAPI, Django, or Flask?
Yes. You can preload jemalloc with LD_PRELOAD and route Python allocations through it with PYTHONMALLOC=malloc. No application code changes are required, but always benchmark before shipping to production.
What does PYTHONMALLOC=malloc do?
It disables Python's own small-object allocator (pymalloc) and sends all allocations directly to the system allocator. When combined with LD_PRELOAD for jemalloc, one allocator manages the whole process, which can reduce awkward interactions between two layers.
Will malloc_trim fix glibc fragmentation?
Usually not by itself. malloc_trim only releases fully unused pages. If even one live object pins a 4 KB page, the page stays resident. In a long-running, fragmented heap, fully empty pages are rare.
When should I NOT use jemalloc?
Skip jemalloc if object counts are growing (real leak), if RSS is already flat, if the process is short-lived, or if workloads consist of a few large, long-lived allocations. Measure first; allocator swaps are not a universal fix.
Should I set MALLOC_ARENA_MAX=2 before switching to jemalloc?
Yes, it is the cheapest experiment. Capping glibc arenas often reduces RSS in multi-threaded Python processes because the GIL already limits the benefit of many arenas. If that is not enough, jemalloc is the next step.
The lesson
The biggest optimization in this story was not a Python change — it was an operating-systems change. Reference counts hit zero, GC ran, and objects were destroyed correctly. The only difference was one layer down.
object dies → refcount 0 → free() → allocator decides → page reusable
                                             ↓
                    "return to Linux, or keep it?"  ← the only step that changed
glibc said: "keep it." jemalloc said: "give it back." Same code. Half the RAM.
The cheat sheet
RSS ≠ live objects. GC frees objects; the allocator decides about pages.
A single live byte pins a whole 4 KB page. That's fragmentation in one sentence.
Stable objects + rising RSS = allocator/fragmentation, not a leak.
 Our on-call dashboard, roughly every four hours.